™
Talk to your data. Watch dashboards build themselves.
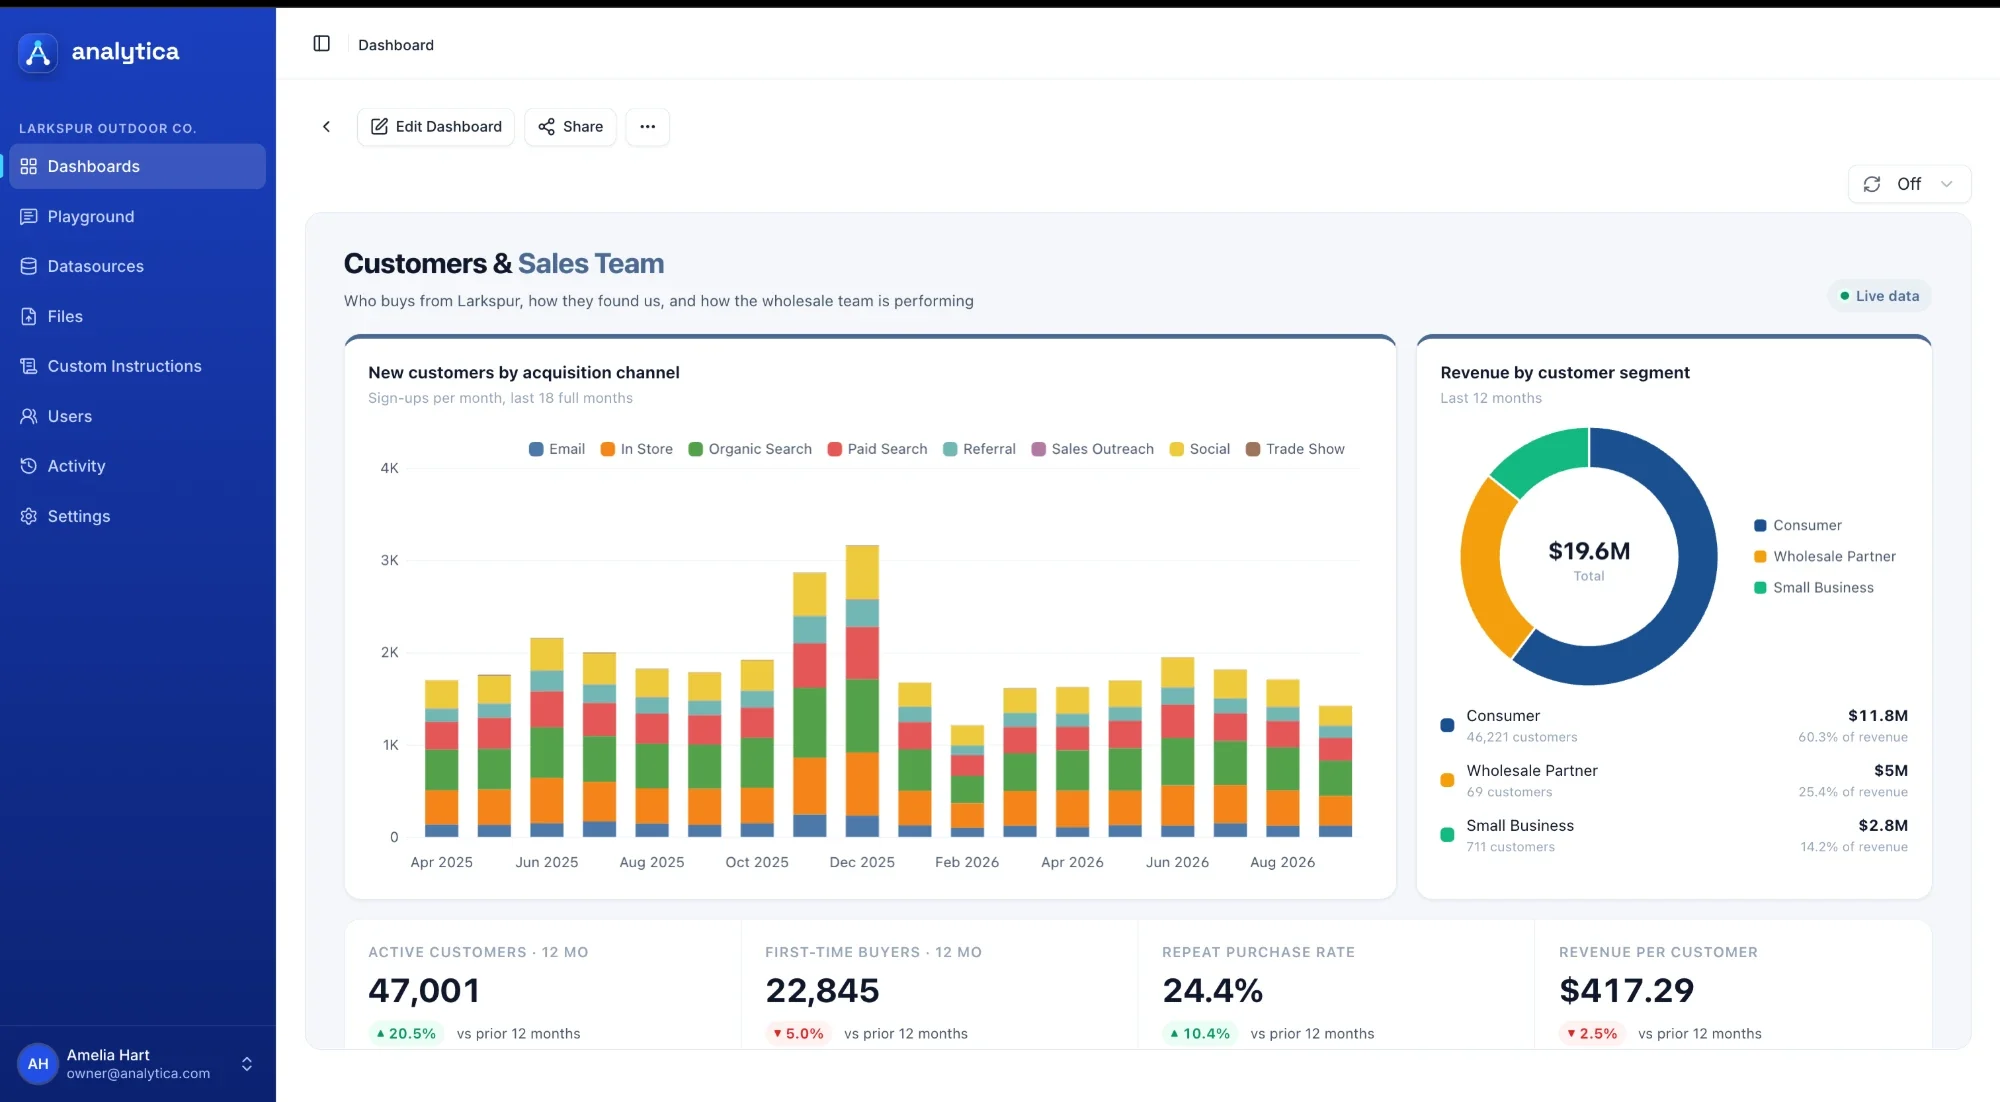
Analytica connects to your databases, spreadsheets and other sources, then builds and edits live dashboards from plain English – every chart wired to real data, shareable the moment it's ready.
- To build a full dashboard
- 1 prompt
- Databases, files & more
- Any source
- Charts, edited by chat
- Live
The problem
Every question becomes a ticket.
Most BI tools answer the question they were built to answer. Anything new means finding whoever owns the dashboard and waiting for a slot on their queue.
Static
A dashboard answers the question it was built for – a new question means a new build.
Locked away
Changing a chart means finding whoever owns the BI tool and waiting for a slot on their queue.
Slow
By the time the new view is ready, the decision it was meant to inform has already been made.
Connect your data
Point it at your data. Any shape, any source.
Databases, spreadsheets, or something else entirely – Analytica connects once and keeps every dashboard in sync with it.
Databases
Connect directly to your production or warehouse database – dashboards stay live against real data.
Files
Upload Excel or CSV exports when there's no database to connect to – Analytica reads them the same way.
Others
Bring in additional sources as your stack grows – Analytica is built to keep adding connections.
How it works
Two ways to work with your data.
Talk to your data, get a straight answer.
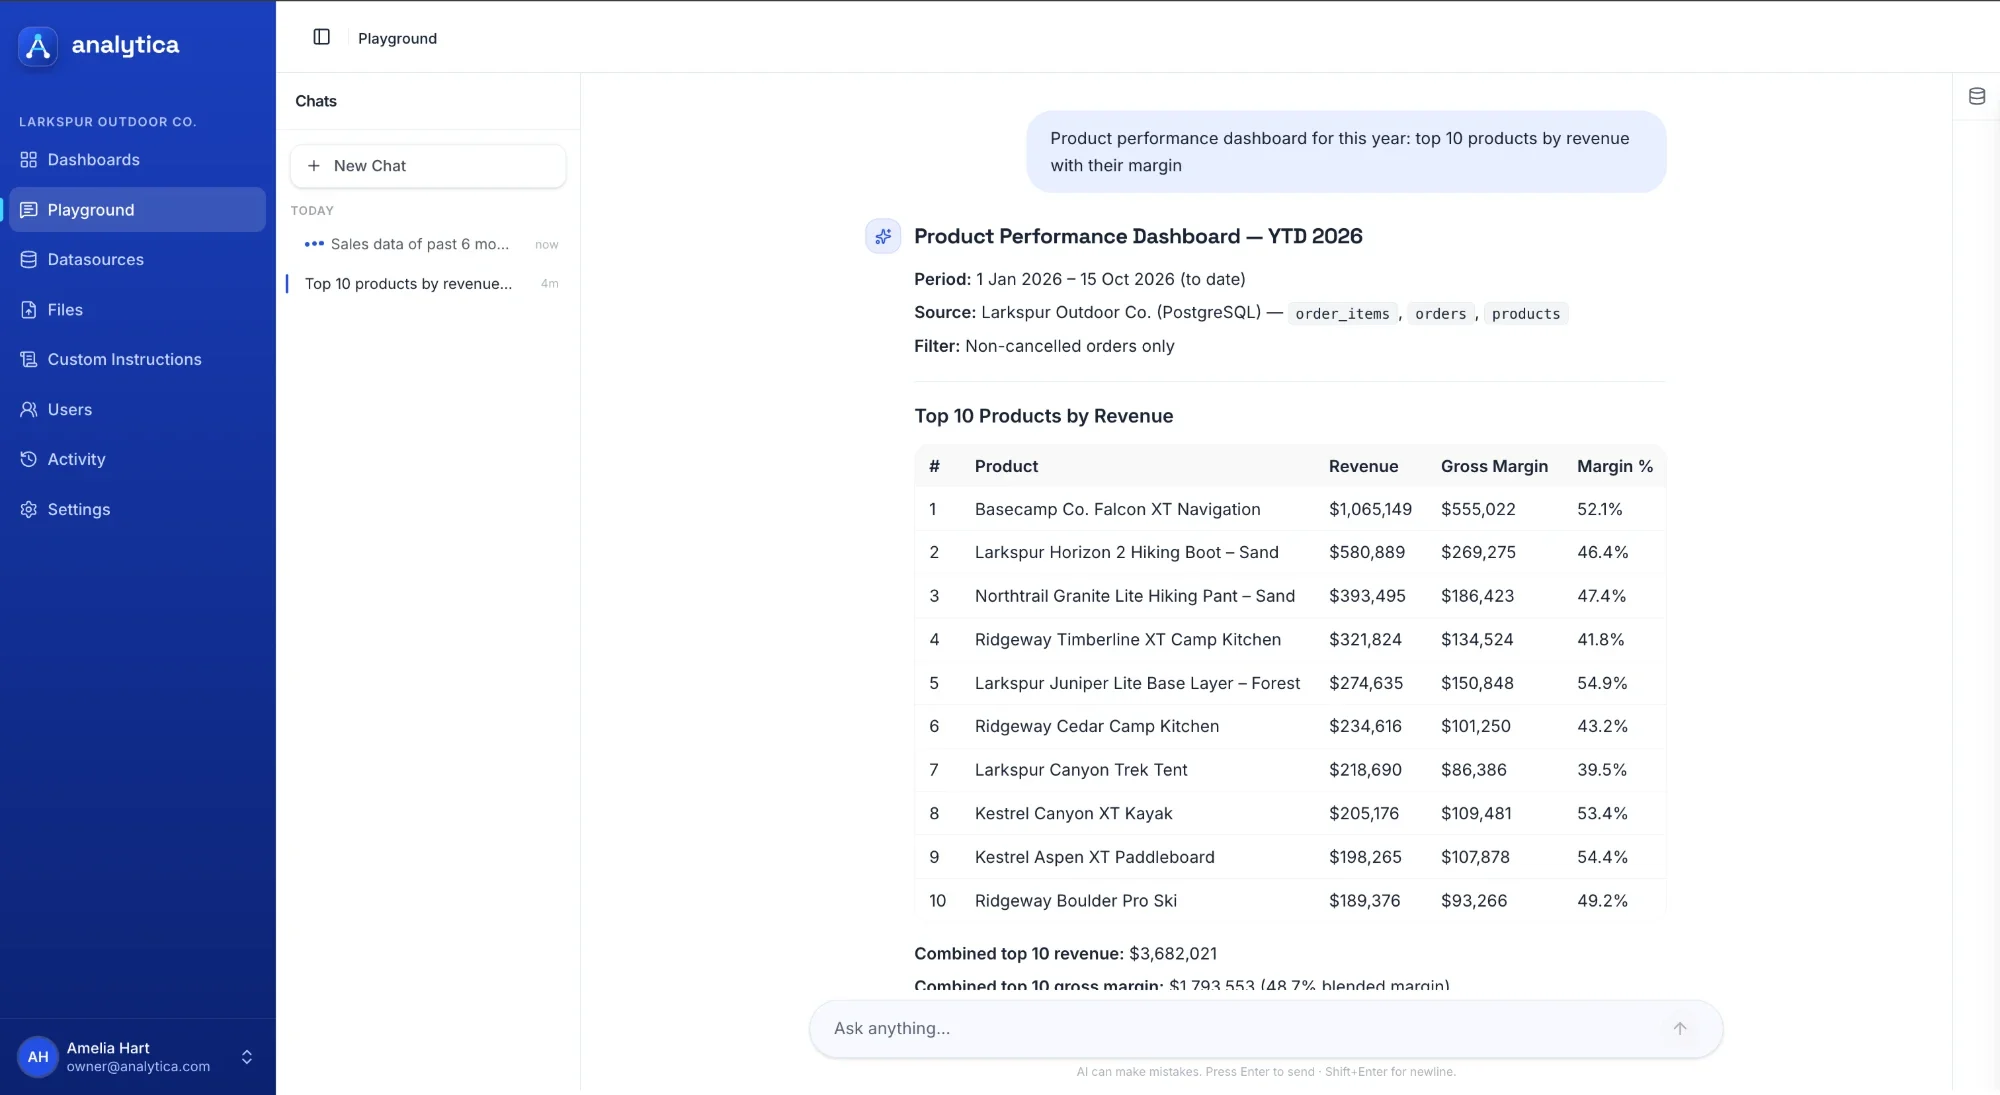
Plain-English requests
Ask for a chart, a color change, or a resize – no query language required.
Edits, not rebuilds
Every follow-up message adjusts the existing dashboard in place.
Describe a dashboard. Watch it appear.
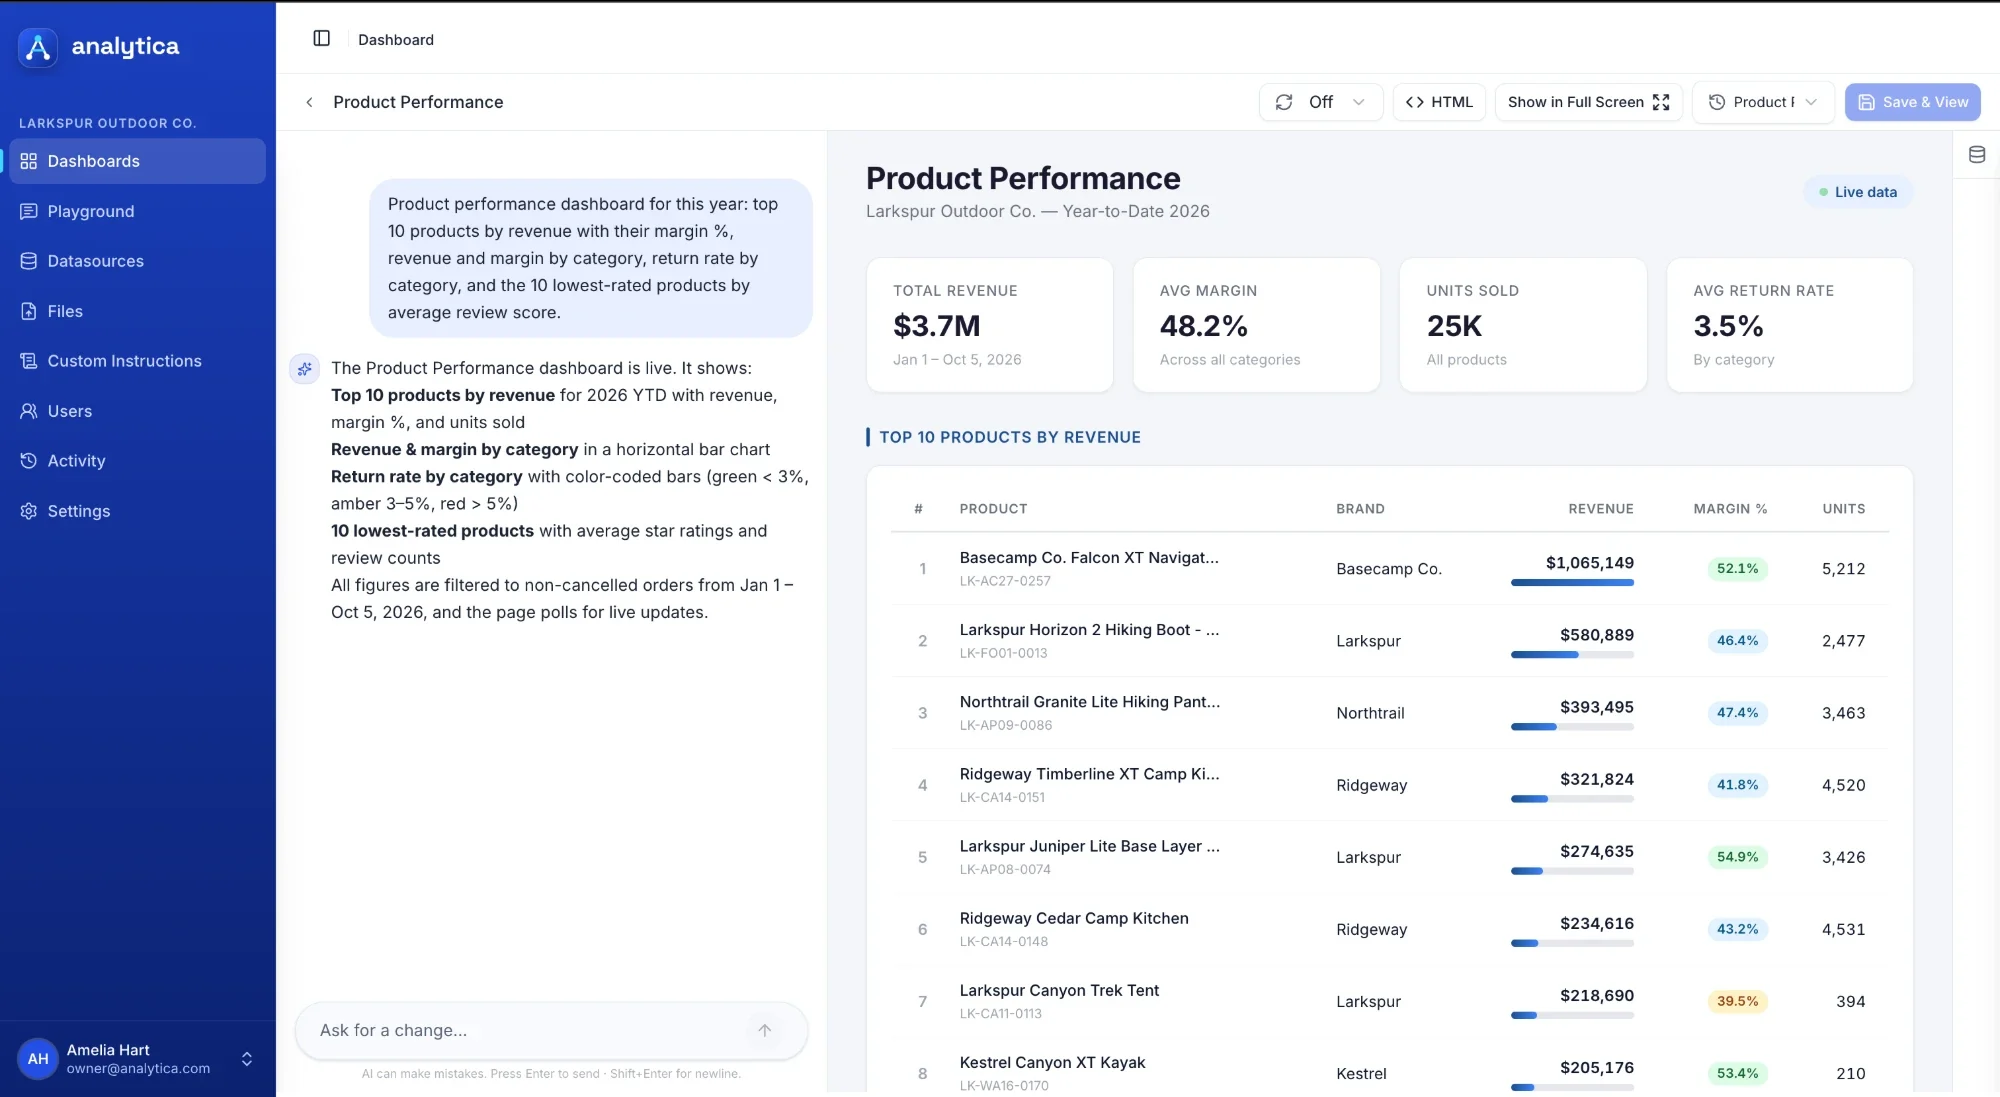
One prompt, a full dashboard
Ask for a professional dashboard of your data and every widget appears, wired and styled.
Versioned & shareable
Every change is saved as a version – share the finished dashboard with your team.
Inside Analytica
Built for the whole team, not just the analyst.
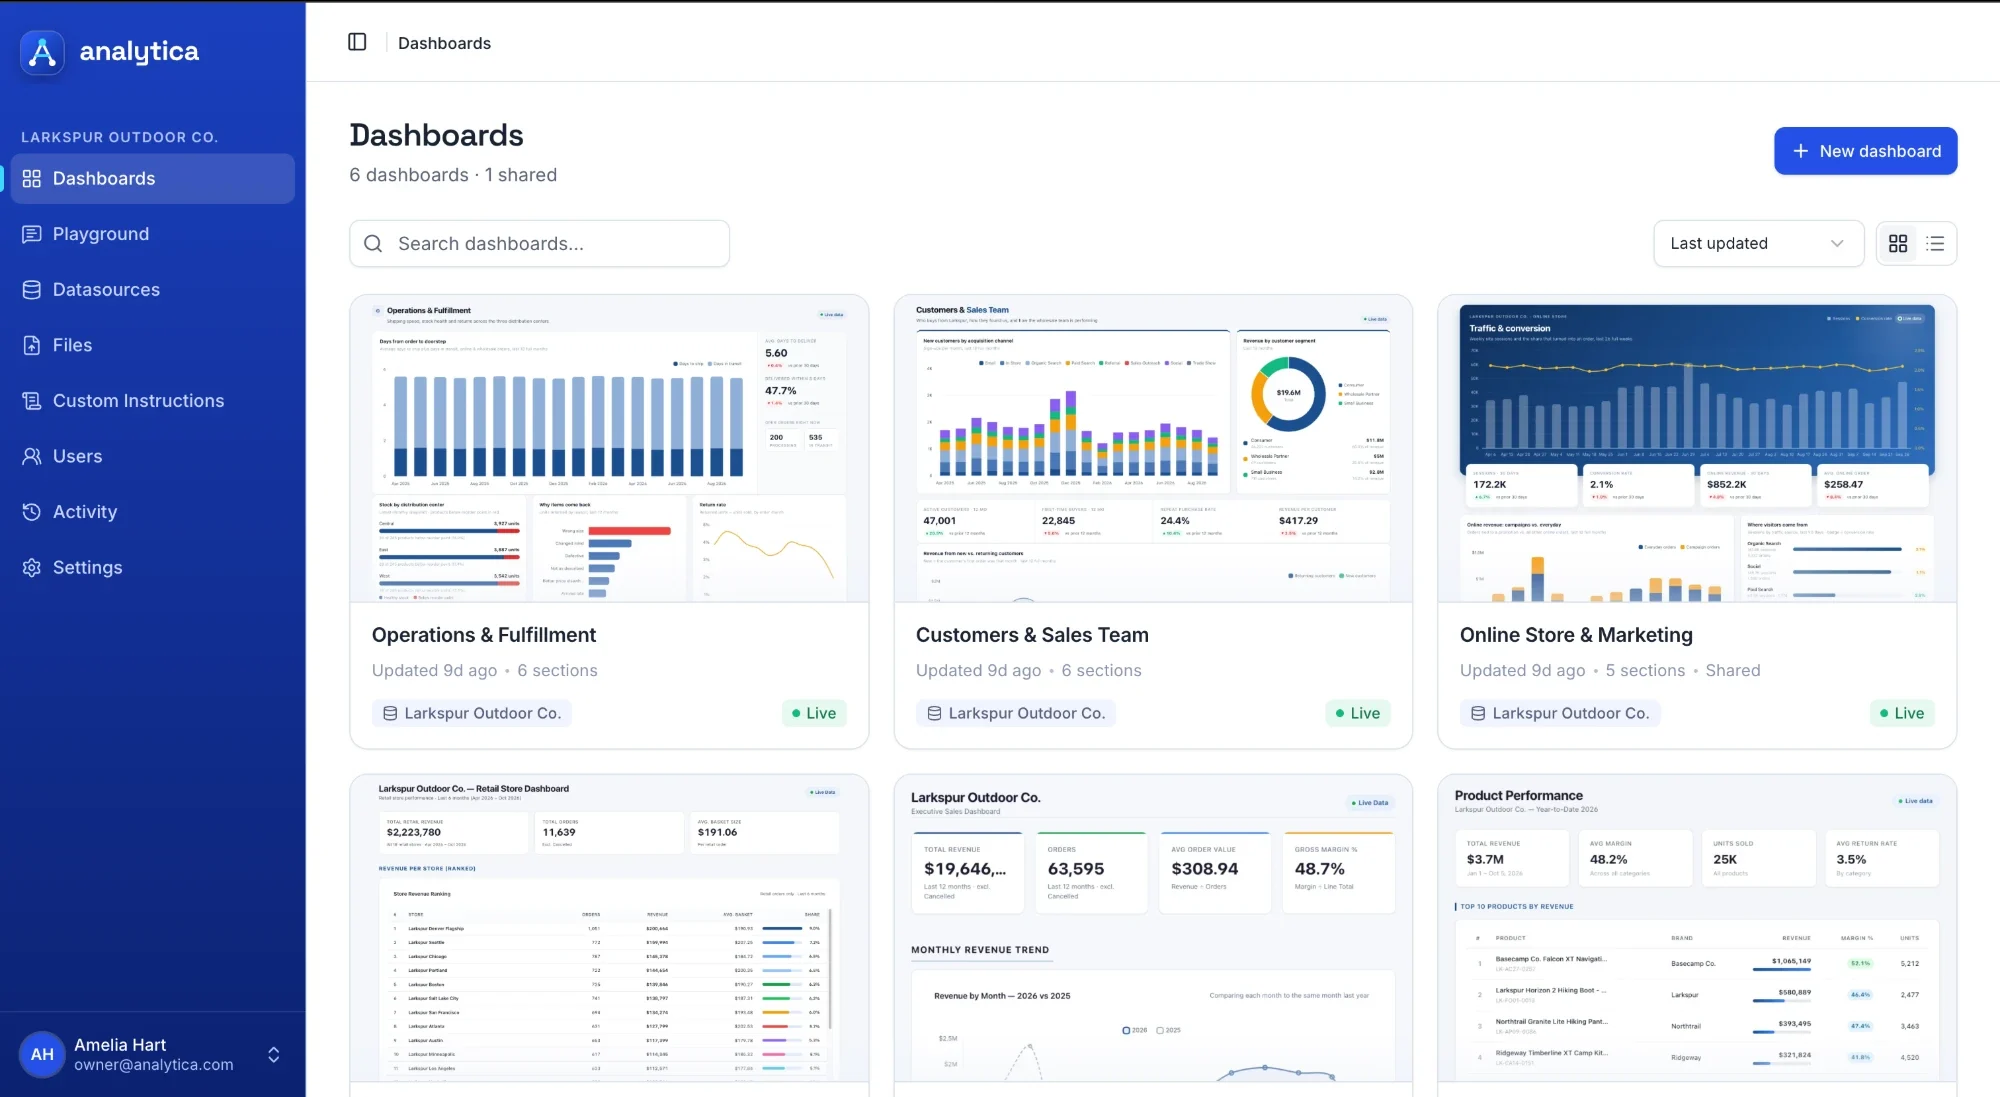
Every dashboard in one place
Operations, sales, marketing and product dashboards in one library – live on your data and shareable with your team.
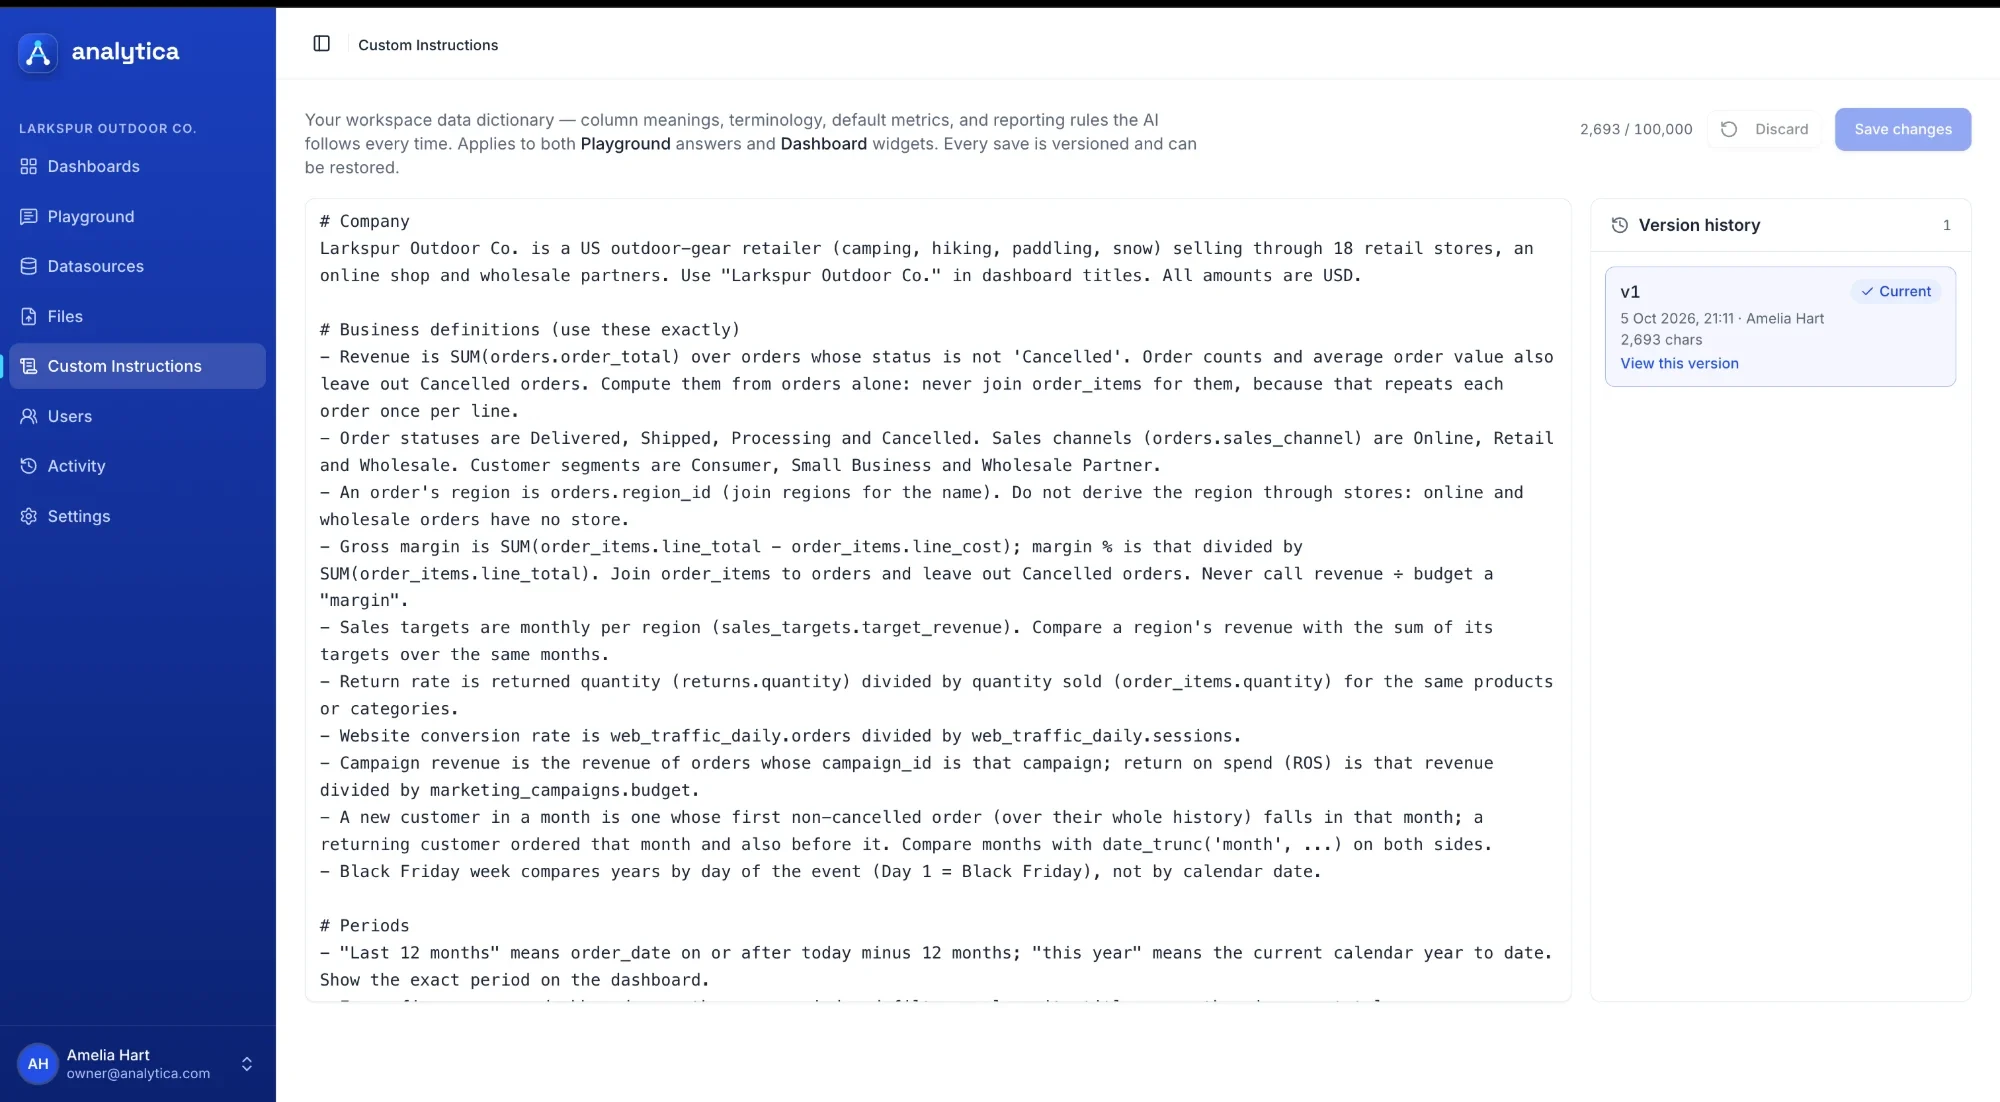
Your business rules, applied every time
A data dictionary of column meanings, definitions and reporting rules the AI follows in every answer and dashboard. Every save is versioned.
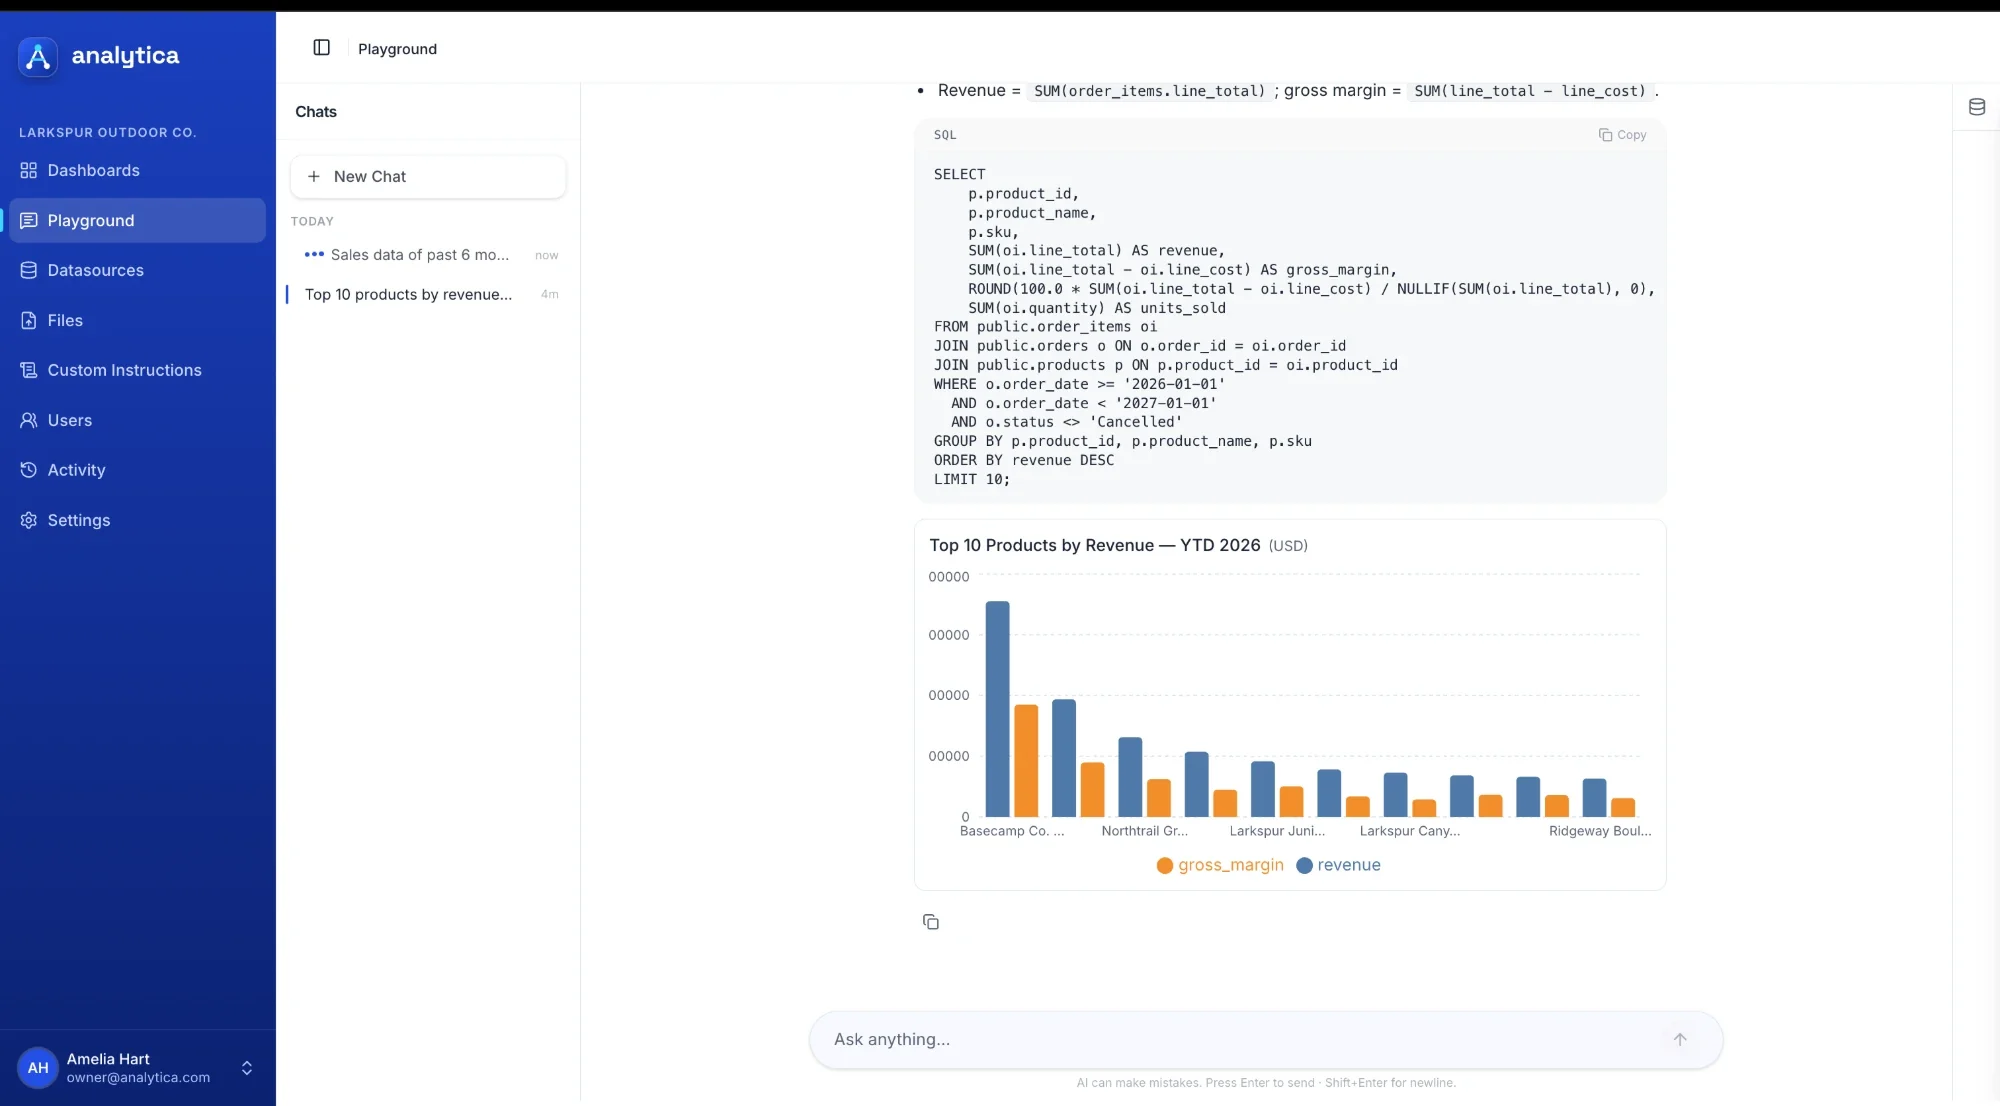
Answers you can check
Every answer shows the SQL behind it, next to the chart, so your analysts can verify the working.
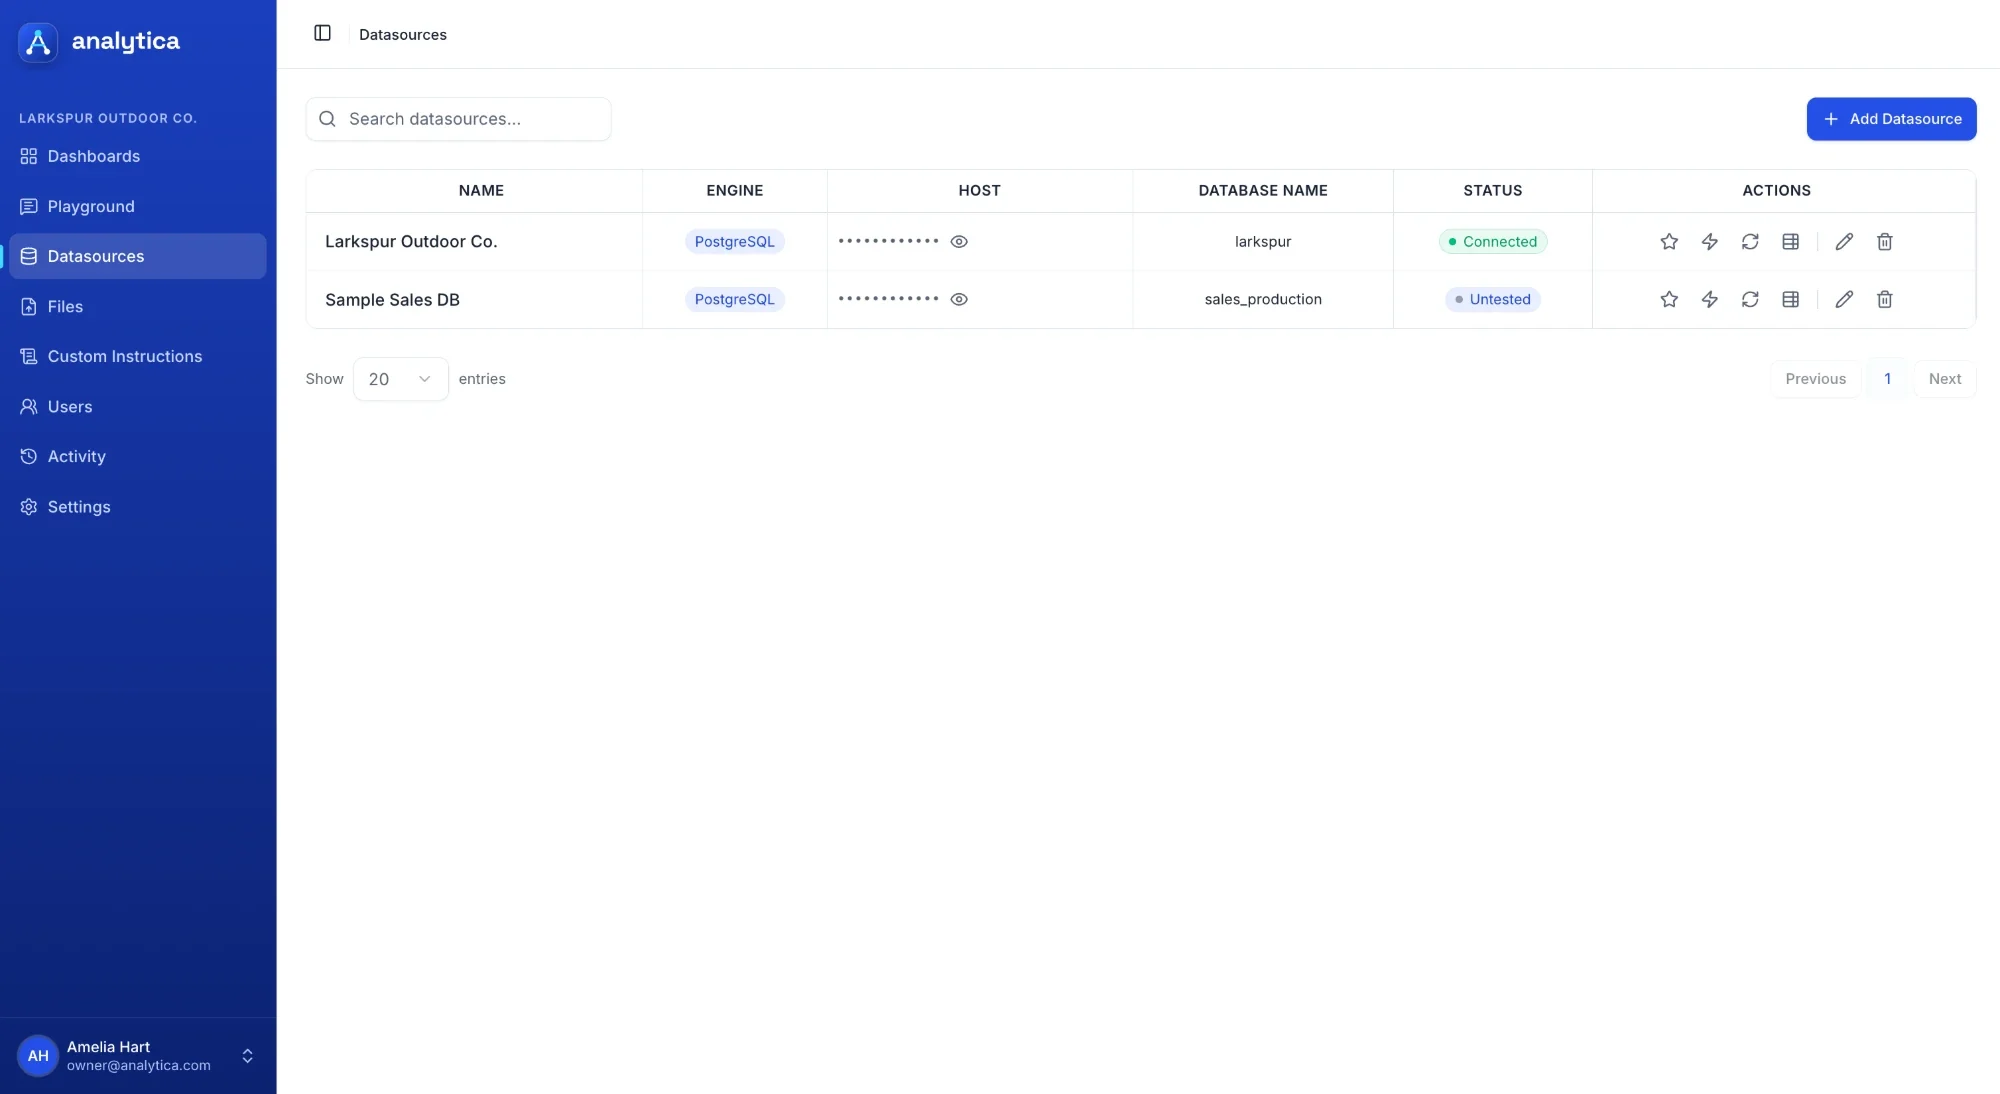
Connect your databases
SQL Server, PostgreSQL, MySQL and MongoDB, with connection status at a glance and hosts hidden by default.
The platform
Everything your team needs to see the data, on one screen.
Natural-language builder
Describe a chart in plain English – Analytica builds it, styled and ready.
Live chart editing
Resize, recolor, or change chart types with a follow-up message – no rebuild required.
Multi-source connections
Databases, spreadsheets and other sources – one dashboard, kept in sync with all of them.
Any chart type
Bar, line, area, pie and doughnut – switch between them without starting over.
Version history
Every change is saved as a version you can review or roll back to.
Shareable dashboards
Publish a finished dashboard and share it with anyone on your team.
See your data differently. One prompt at a time.
Point Analytica at your data and describe the dashboard you need. We'll help you get your first one live.
Book a call